
Why a virtualization tool is a useful asset for your digital supply chain
Physical restrictions on the plant premises, time pressure due to on-time deliveries and fast truck throughput times increasingly require an overview of the current operating situation.
These must present all relevant information at a glance in a self-explanatory manner and be available in real time. We show different purposes and application examples for a visualization of your logistics processes. In the following you will find examples of applications for yard and track visualization as well as the illustration of berths in your dock.
Supporting the decision-making procedure
Only those who know the current operating situation at all times can make the right decisions in scheduling. But how do I get an overview of the transport means, goods and locations in real time without having to consult several reports and lists?
We frequently encounter the following questions in customer projects:
- What means of transport are currently on my premises?
- What is the capacity utilization of my locations?
- What is the current process status of the resource?
- Where can I find a specific vehicle, wagon, container or swap body?
- Where is a specific loading resource or cargo unit located?
- Which resources are located in the yard and can be easily outsourced?
Added value for your logistics processes
For reasons of plant security, but also to ensure the smooth running of the often collaborative supply chain processes, it is extremely important to maintain an overview. Internal plant traffic must be efficient, and decisions must be made swiftly and on the basis of the correct information.
Which tools can support me in this?
- Tabular overviews of means of transport on the site allow quick queries.
- KPIs and graphical evaluations can also be used for real-time analyses, especially for downtimes, freight handling and checking capacity limits on the site.
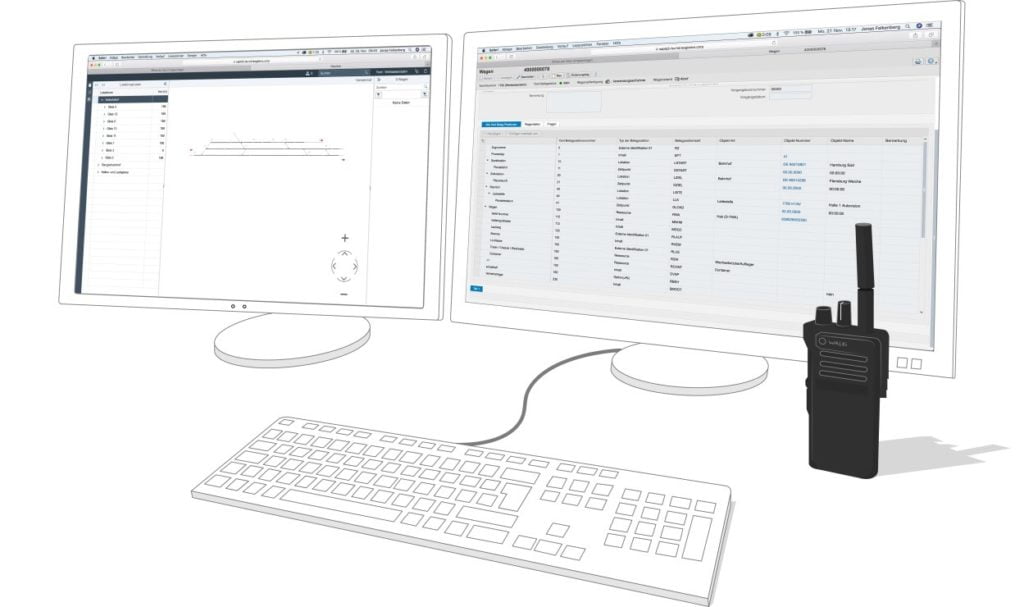
- A visualization of the operating situation in one’s own area of responsibility (with or without GPS information) is often a useful extension to display the As-Is situation on a central monitor. A jump to the respective underlying order document enables direct triggering of actions or provides required detailed information. A visualization of the current operating situation is standard at a modern dispatcher workstation.
Hereafter you will find a number of application areas based on the leogistics Yard Visualizer. In addition to the classic truck yard visualization, factory railway and ship berths were used as examples.
Area of use: visualization on a truck yard
Within the classic truck process, the visualization supports the scheduler in making decisions for optimal control of the processes on the yard.
Individual areas of the plant premises can be graphically displayed as a top view.
Furthermore, in order to display the current process status in the visualization, the status value of a truck can be represented by frame color, fill color or hatching.
This color notation enables the dispatcher to quickly identify the truck status in the process.
In addition, information can be displayed by mouse-over. Thus, it is clearly visible which truck is waiting for a call for loading and which truck is waiting for outgoing weighing.
Individual actions in the process, such as calling up a waiting truck to the loading gate, can be conveniently carried out via the graphical user interface.
Area of use: shunting disposition and operation of loading points in railway processes
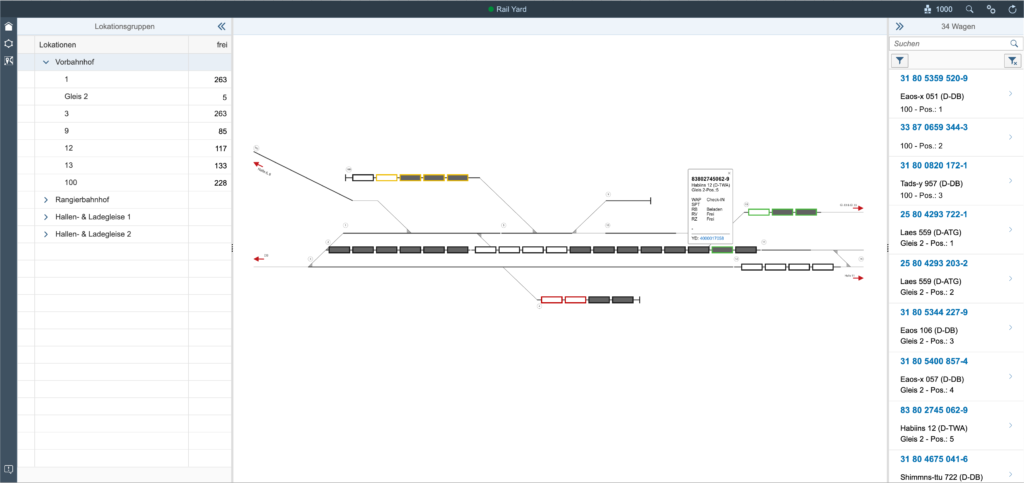
Another use case for a visualization of logistics processes is the railway as a mode of transport. A track diagram visualization is indispensable for the control of operative factory railway processes. The scheduler must have information on the current operating situation in the yard at all times.
Based on this information, the dispatcher makes important decisions. The track visualization shows him which wagon is on which track. He receives additional information on the type, loading status, load and process type.
The process steps listed below can only be carried out without errors if there is complete transparency at all times regarding the location of each individual wagon:
- the dismantling of the incoming trains,
- the punctual service of the loading points with the correct wagons,
- the wagon exchange between loading points,
- Circulation in the factory, transfer of the wagons between the shunting areas,
- the removal of loaded or unloaded wagons from the loading points and
- the formation of outbound trains.
A process example from the industrial railway environment
A loading station requires an empty wagon of a certain type. The integrated search help in the track visualization gives the works railway dispatcher the possibility to search for this type of wagon.
The result of the search returns all wagons of this type with location. The dispatcher can now decide which wagon is the easiest for the shunting locomotive to shunt in order to serve the loading point effectively and on time.
Area of use: berth planning for ships
For operators of their own terminal or dock, a graphical representation of all inland or seagoing vessels at the respective berth can be a suitable tool for making decisions on the berthing of further vessels or general traffic planning (entry and exit).

Searching for ships, using a mouse-over with corresponding additional information and a color coding according to the respective process status (e.g. moored, in loading/unloading, dispatched) are the key functions of this visualization.
The yard designer as part of leogistics d.s.c.
The Yard Designer is the counterpart of the Yard Visualization. Both tools are an indispensable part of leogistics d.s.c.and are used in various industries.
The Yard Designer is a graphical tool that allows the user to model the locations of the yard based on the existing master data via drag & drop.
Base data information such as the length of a track, for example, supports the user when creating locations in a GEO map or in the schematic representation.
The possibility of dividing the yard into different areas/groups (e.g. pre-station, warehouse, loading gates) creates additional clarity and the possibility of separating different modes of transport on a yard (e.g. truck/rail). For each visualization group a self-created graphic can be used as background overlay.
When it comes to modelling, for example, several truck parking spaces at loading gates, Yard Designer offers various wizards that allow the system to be set up quickly, conveniently and flexibly. Even changes to already drawn locations can be easily carried out by the user.
Which benefits does the yard designer bring in the running operation?
One of the benefits of the Yard Designer is that you can react independently to structural changes in the yard. If a new loading hall is built on the yard, you can easily draw the new locations later using the Yard Designer.
During peak periods, companies often move to storage areas outside their own plant boundaries and rent temporary storage space. These storage areas must also be managed. The Yard Designer allows you to create these locations quickly and easily using a graphical user interface.
Which device for yard visualizer and designer
The SAP UI5 framework provides the user with a modern, tidy and high-performance user interface, which can be executed on the 65-inch screen in the entrance hall, on the desktop of the dispatcher workstation, on a tablet or on the smartphone in a responsive manner.
Geomap or schematic view?
These two types of visualization are complementary.
In schematic visualization, the main objective is to display as many locations and information as possible on one screen.
This is comparable to the representation of a subway network. It is possible to display storage locations and halls on one screen directly next to each other and in other size relations, although in reality these are several hundred meters apart and of different sizes.
In reality, for instance, the dispatcher would like to display the truck check-in area together with gates at the halls on one screen, without zoom and scrolling. The advantage of this display is obvious: He gets a lot of information compressed on one screen.
The geo-visualization of locations and resources based on OpenStreetMap, HERE or GoogleMaps shows the actual location based on GPS coordinates.
For each location the correct GPS coordinates can be recorded or graphically displayed on the GEO map in Yard Designer. Thus it is possible to determine via GPS tracking when a resource is located at which location in order to trigger the corresponding follow-up processes.
Heading towards your digital yard twin
The integration of sensor data into the visualization offers additional benefits. It is possible to control the resource allocation (of e.g. loading points) by means of IoT devices, or to display GPS information and the display of current measured data (such as temperature, air pressure) on a map.
Are you also interested in a visual representation of your logistical area of responsibility? Can real-time information about your resources and locations – displayed in a graphically clear way – help you in your decision-making?
We would be happy to advise you on the analysis of your requirements and implement them for you.
If you have any questions about this or other topics in the blog, please contact blog@leogistics.com.
Frank Würschnitzer
Development Architect
