
Draw conclusions on the performance in stock with clear, individual dashboards and the right KPI's.
As digital real-time data becomes more abundant, the potential of appropriate reporting for companies is also growing. A targeted and suitable analysis of this data offers the possibility of optimizing processes and identifying weak points at an early stage. The information gained can be a basis of analysis for both strategic management and operations in order to optimize logistical processes.
Only targeted reporting enables a broad and in-depth analysis of processes. This makes it possible to find defects in the respective processes. For example, a delay in deliveries could be due to low inventory accuracy or increased employee utilization. To provide the right reporting for your own processes, it is important to use the right key performance indicators (KPI’s) and the right visualization and reporting tool. However, due to the multitude of reporting tools and KPI’s, it is difficult to map only the relevant sections of your processes. We therefore discuss below what options are available to you in order to integrate the perfectly tailored reporting into your system landscape.
Which KPI's and reports are of particular interest for a target analysis of storage processes?
In principle, reporting can be divided into operational and strategic reporting. The operational key figures are primarily short-term and are primarily aimed at the employees directly in the warehouse, while the strategic key figures are more intended for the management, who carry out long-term planning and accordingly need their data prepared for longer periods. These operational key figures can also be used for strategic planning if they are viewed over a longer period of time.
Key operating figures
- Pending and completed stock orders
On the one hand, the pending and completed warehouse orders serve as an aid for the warehouse staff to know quickly and clearly what orders still have to be completed. On the other hand, this number can also be analyzed over a certain period of time and thus, for example, it can be documented at which times or days a particularly large number of orders are received. These figures can be filtered and sorted according to requirements, e.g. by warehouse type. This high flexibility makes it an interesting key figure.
- Processing time
The processing time is a very flexible key figure that can be used in many ways. It measures the time from receipt of the warehouse order to completion of the order and provides short-term information on how efficiently the work is being carried out. For example, it is possible to determine which days of the week are the most efficient. This key figure can also be viewed in the long term, which is also interesting for the strategic framework.
- Stock level
The stock level provides information about how many units are still in the warehouse. This can be particularly interesting for fast-moving items, as it can be seen at an early stage whether the stock is nearing its end and needs to be reordered. This allows for more flexible order planning.
Key strategic figures
- Resource utilization
The resource utilization is undoubtedly one of the decisive key figures for long-term planning. It indicates the percentage of resources such as employees, packing zones, machines, etc. that are being utilized. Based on this, it can be deduced in which areas more capacity is needed and where savings can be made if necessary.
- Stock accuracy
To have an overview of what exactly is still in the warehouse, the stock level can be recorded. The stock accuracy is an additional control factor, which indicates the deviation between electronically recorded and real stock. This deviation lets management and employees recognize early on that the deviation between nominal and actual stock could become too large.
- Delivery accuracy
In order to determine the actual service quality within the warehouse, the delivery accuracy is used. This shows how many of the warehouse orders were processed on time. As with most other key figures, it is important that these are sorted or filtered according to the needs. As an extension to the delivery accuracy, the perfect order rate can also be used, which indicates the percentage of stock orders in which there were no errors.
Report guide
You need the right analysis and reporting tool to use reports that are tailored to your specific needs. SAP EWM offers three relevant options for reports:
- directly in SAP EWM
- by means of SAP Business Warehouse (a SAP Business Intelligence package)
- with leogistics REPORT.
Reporting directly in SAP EWM
By means of the warehouse management monitor and the warehouse cockpit, SAP EWM provides two tools for individual and targeted reporting in the warehouse. While the warehouse cockpit provides a quick view of the key figures through visual elements, the warehouse management monitor provides a detailed view of the processes.
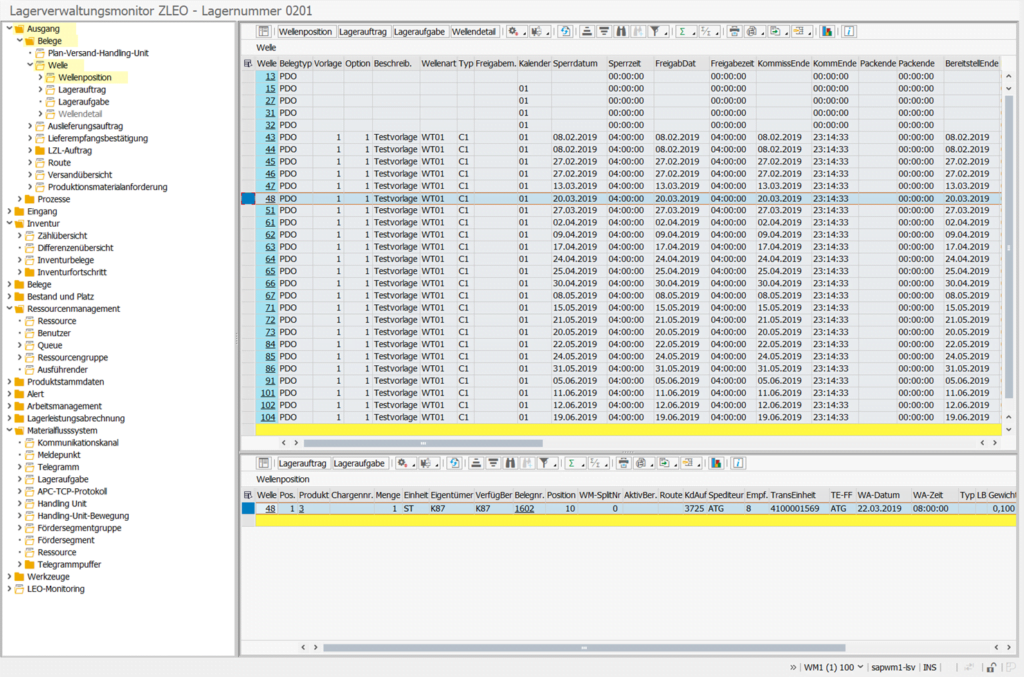
- Warehouse Management Monitor
The warehouse management monitor is the central tool in SAP EWM. Here, in addition to various documents of the warehouse, information on storage locations and stock information can be retrieved, clustered and evaluated. However, the warehouse management monitor is not only a tool for display and evaluation, it is also possible to directly edit documents, block storage locations or jump to other transactions.
Representations can be individually prepared, then saved and dragged into Excel for further processing. By means of various filter options and the creation of totals and subtotals in the displays, the warehouse management monitor also allows a quick and rough overview of a warehouse situation.
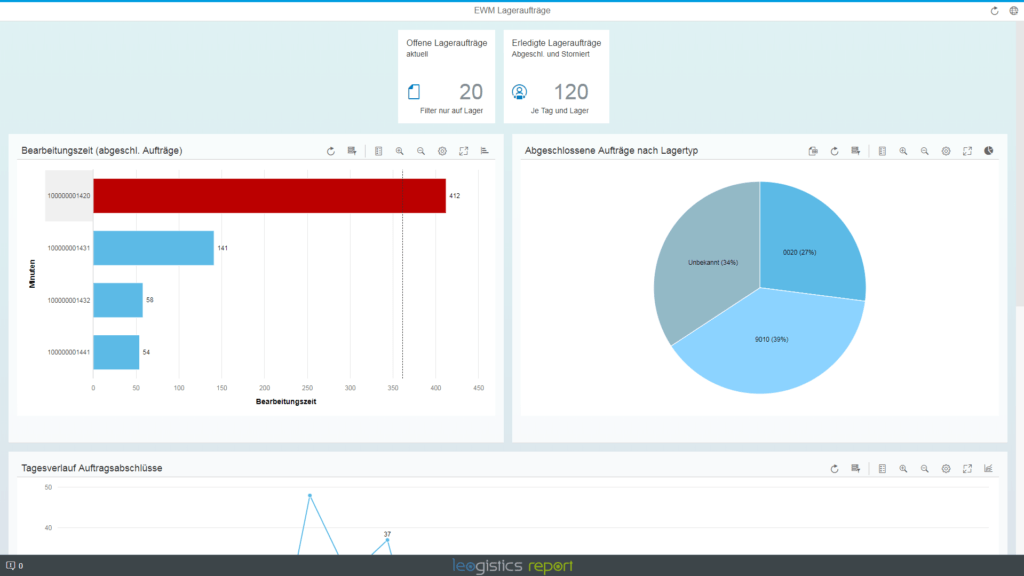
- Warehouse cockpit
The Warehouse Cockpit offers a graphical presentation of the current situation/utilization of the physical warehouse and thus represents an optimal extension of the reporting to the Warehouse Management Monitor.
Various display formats (bars, columns, tachometers, etc.) allow various key figures to be displayed optimally; individual threshold values allow a deviation from the optimum to be quickly detected, thus allowing a prompt reaction. The auto-refresh function keeps the graphics up-to-date at all times.
SAP Business Warehouse
SAP Business Warehouse (SAP BW) offers a variety of reports with different key figures and is particularly suitable for strategic reporting. It provides the advantage that, as a third software, it can also combine reports from several SAP modules. For example, the perfect order rate from EWM and TM can be combined to a perfect order rate over the entire delivery cycle. Thus, a broader analysis can be performed. The Performance Dashboard add-on also allows retroactive analysis of data from the last 12 months, which makes SAP BW a valuable tool even without new data.
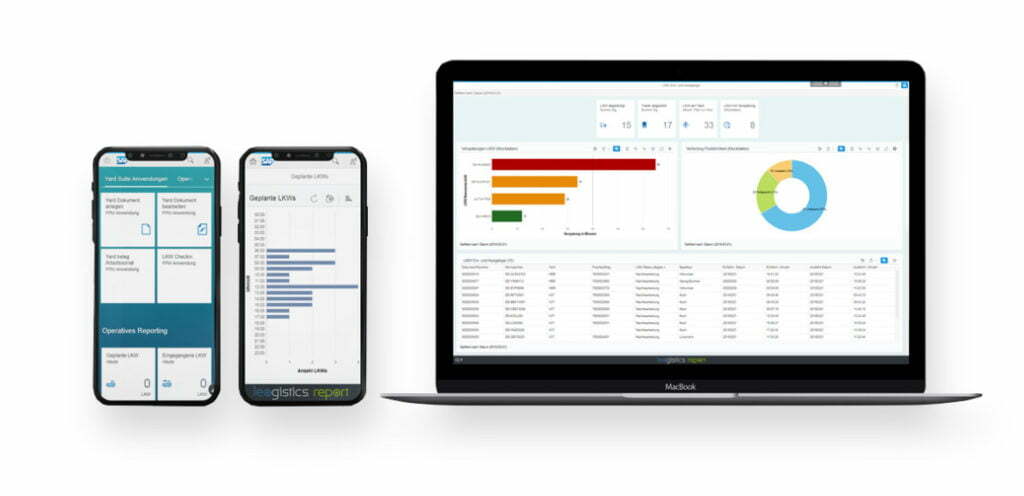
Extended possibilities in operative reporting with leogistics REPORT
In addition to the methods created by SAP for creating reports and dashboards, there is also the leogistics REPORT developed by us. This is focused on operative reporting and can be adapted very flexibly to customer requirements. The very user-friendly real-time data is particularly interesting for companies that need UI/UX-friendly reporting but do not yet want to implement an S/4HANA upgrade. A further advantage is that leogisitcs REPORT can also be integrated for the entire supply chain, enabling the creation of comprehensive KPIs and reports.
BOTTOM LINE
Reporting possibilities in SAP EWM are manifold!
Would you like to use the standard system or do you even have SAP BW in use? Then you already have a large number of reports and key figures available out-of-the-box.
Are those not enough? In this case, you need to find the right environment to implement your extensions.
The optimal combination for your application area, consisting of KPI’s and their visualization in a dashboard, enables you to analyze and plan warehouse processes. Especially for operative reporting, our in-house leogistics REPORT can be perfectly integrated into your system landscape.
We will be happy to advise you on any questions you may have about reporting! If you have any questions about this or other topics in the blog, please contact blog@leogistics.com.
Max Ramcke
Dualer Student leogistics GmbH
Florian Schorcht
Consultant SAP Logistics
