The Bullwhip-Effect: Using the right tools together and establishing robust supply chains.
In challenging times, supply chains fall under pressure in many areas. By using small, simple tools at the crucial points of the chain, the entire supply network can be secured and sustainably optimized – without putting individual partners at a disadvantage.
The Bullwhip Effect and its impact on the supply chain
Generally speaking, the bullwhip effect is often found in the literature as an extreme example of the negative effects that threaten a non-integrated and uncoordinated supply chain. Often an increase in sales volume is used to explain the effect in the preceding supply stages, but a one time reduction of the order quantity in sales can also trigger this effect.
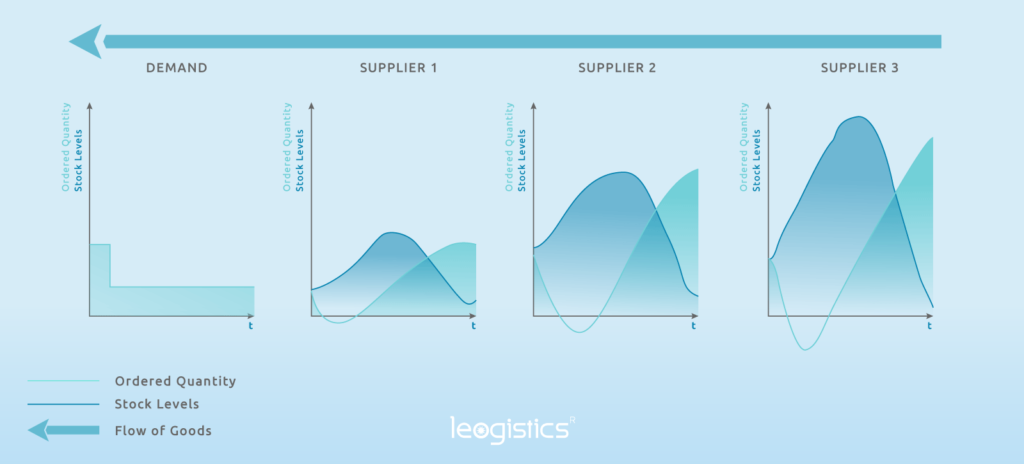
The graphic shows the order quantity and the stock over time. It displays the flow of goods in the supply chain over several supply levels. Triggering the bullwhip effect is a reduction in demand in sales (green line) in the first graph. Very striking in the example: demand in the form of the order quantity collapses by half.
- The effect on supply stage 1
Due to the one-sided reduction of the order quantity in sales, inventories are quickly built up in stage 1 (blue line). Stage 1 has to react and reduces the order quantity in supply stage 2 in order to empty its own warehouses. At the beginning, the order quantity even falls into the negative range due to full warehouses, i.e. there is no flow of goods between the first and second level.
Over time (about halfway through the diagram), we see the trend change: The stock in the own warehouses is reduced more quickly due to the now constant orders in sales, stage 1 therefore orders more volume at stage 2. Stage 2 can initially supply through its own stocks. If these are used up, delivery cannot take place as quickly as desired due to delivery bottlenecks; order quantities remain unfulfilled and inventories continue to decline while order quantities are increased even further.
- The effect on supply level 2
Level 2 is similar to level 1, but the deflections for order and stock quantity are significantly higher. Triggered by the collapse of order quantities from level 1, inventories are quickly built up at level 2. The order quantity of level 2 at level 3 falls into the negative range. Here, too, the trend reverses over time: Declining inventories due to order fulfillment are offset by rising order quantities.
- The effect on supply level 3
Here we can see the highest deflections in the progression. Inventories are rising steeply, while orders are being held back for a longer period of time as further steps are taken.
What can be deduced from this?
The further a supply stage is away from sales and the more supply stages have moved in between, the more serious the effects on order quantity and stock levels.
What strategic solutions are appropriate?
This very dramatic example is mitigated in reality by strategic collaboration models (supply chain integration). Once the game rules between the partners have been clarified at the strategic level, the tactical and operational units at each level can consult each other and carry out joint supply planning. As a result, strategic contingents and cross-level scheduling agreements can almost completely prevent the bullwhip effect. Collaboration platforms can be helpful here, especially in operative logistics.
Among the two options for working across companies on the basis of scheduling agreements and delivery schedules are the SAP Logistics Business Network with the Freight Collaboration module and the 360° logistics platform myleo / dsc.
- The Freight Collaboration (SAP LBN) module enables early collaboration with the freight forwarder, planning time slots and tracking deliveries. In case of bottlenecks or deviations, it is thus possible to react at an early stage.
- The 360° logistics platform myleo / dsc offers the possibility of complete supplier integration and end-to-end notification of deliveries. This means that the supplier can directly notify the ordered / called-off goods, make any necessary changes and at the same time instruct the carrier. The following time slots can also be booked and the delivery can be tracked.
In both variants it is possible to trigger automated follow-up activities on the factory premises, in the warehouse and in production.
Operational and tactical tools
The entire supply chain can only be coordinated if the individual stages are able to control and manage the given situation. As a basis for control, a continuous evaluation of the current situation and the short-term development is required – the evaluation takes place in the downstream control process group.
Basic standard analyses for short-term warehouse development are provided in SAP’s warehouse management solutions, for example, through the Rough Workload Estimate in SAP WM or the Labour Management in SAP EWM.
Through the foresight analysis of orders, sales orders and deliveries, the development of the current situation can be quickly evaluated using uniform key figures.
However, if individual key figures and KPIs for each supply level are defined by the overall control process group in the context of supply chain integration, the SAP standard reaches its limits. Essential standard key figures (such as warehouse range of coverage, inventory turnover, warehouse utilization rate, inventory cost rate) and individually defined key figures must be analyzed using similar data sources in order to make them comparable.
In practice, supply chain partners therefore introduce obligatory dashboards with which they also evaluate specially agreed key figures in the same way. A connection to the SAP solutions used in the respective companies in the areas of warehouse management and transportation is possible and easy to integrate through continuous data collection.
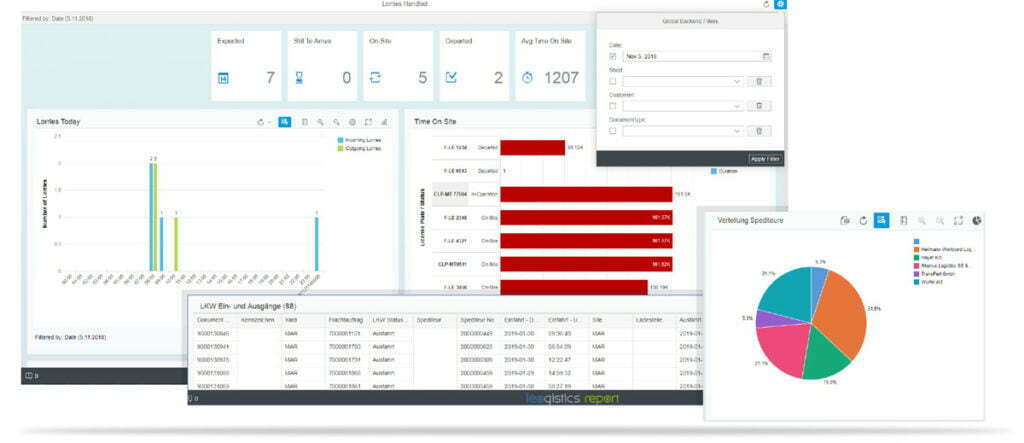
Uniform evaluation means that the cross-company committees have the right tool in the right place and can intervene in the network to regulate it. The harmonized database also makes it easy to carry out collaborative weekly and monthly planning and joint forecasting based on KPIs.
Effects on quantities to be transported
In the case of the bullwhip effect, let us now look at the intermediate stages between the warehouses, i.e. the transport volumes:
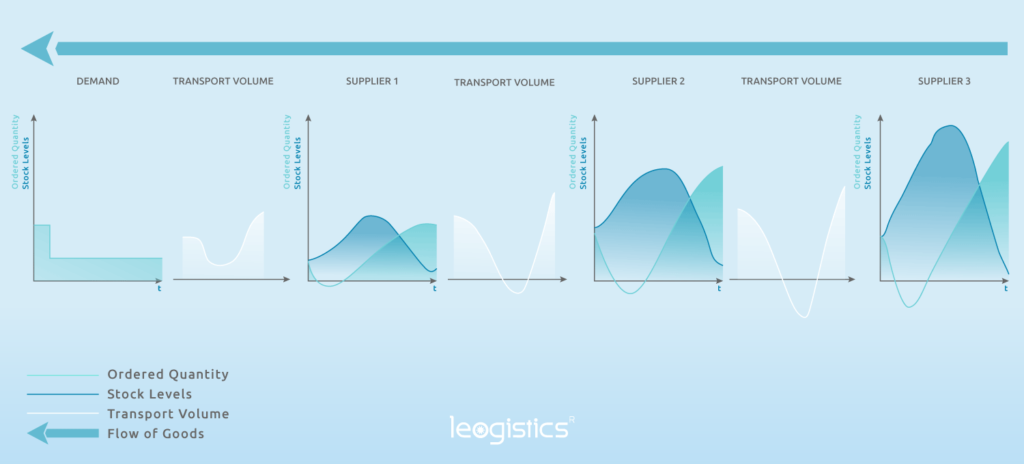
The graphic shows that the shipped quantities between the stages are similar to the order quantities. If the order quantity is reduced, the shipment quantity is reduced in the same way with a slight time offset. If a supply level attempts to reduce the stock level over time, the quantities to be transported increase.
This concerns not only the trading partners in the supply chain stages, but also the transport organizations and transport partners along the chain. An additional complicating factor is that although the transporters are represented in the committees of overarching steering groups, they cannot necessarily use the information from these committees to improve their own situation.
Using a container terminal as an example
Although the terminal is informed that the transport volumes are collapsing, it has to provide both personnel and storage space for the containers that are now unused, and in extreme cases even expand them. The data provided within the collaboration can be processed into corresponding information for internal control and evaluated using dashboards:
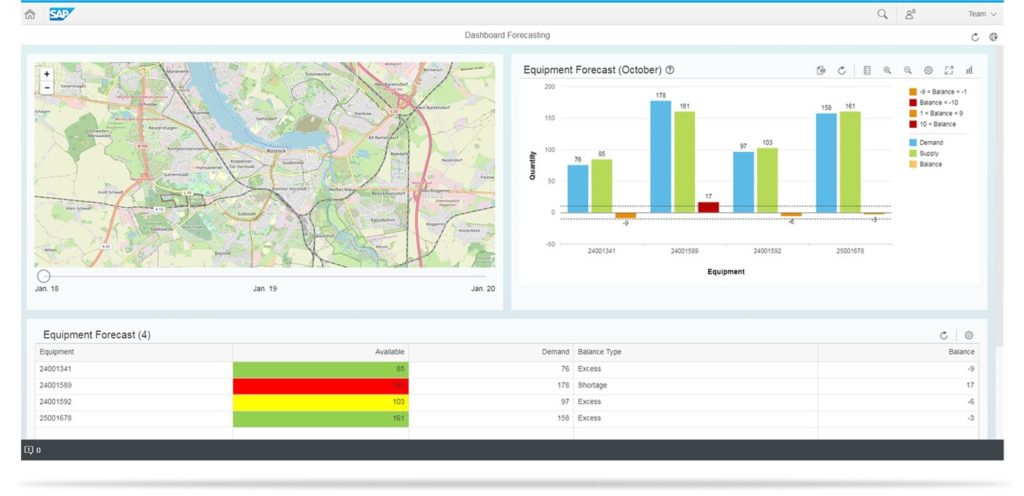
Forecasting models can be used to predict the duration of the collapse. The company as a whole remains capable of planning. However, in terms of holistic supply chain collaboration, this situation calls for creative approaches: Can trading partners, for their part, commission non-productive transports (e.g. transfers between warehouses) as a substitute for the other transport collapse? What transport capacities can be obtained with such replacements?
The trend reversion for terminals and transporters
After the stagnation that has been overcome, transport volumes are increasing again. In addition, the emptying of the warehouses of the supply levels causes the transport volume per connecting link to rise even above the historical transport volume. Carriers emerge stronger from the crisis situation but are confronted with the next challenge: The increased delivery volumes have to be managed while initially maintaining the same capacities. Operational planning is supported by the use of automated transport planning solutions, which propose an intelligent combination of goods to be transported or transportation rounds.
Supply chain collaboration
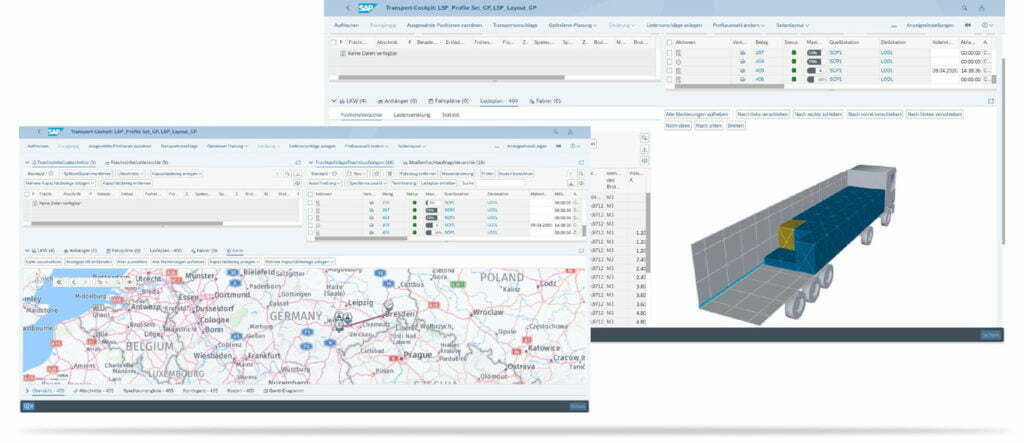
The strategically defined cooperation within and along the supply chain form the basis for joint tactical and operational planning in exceptional situations and enable the network to react in solidarity to changes in sales volumes. Supply Chain Collaboration Tools such as myleo / dsc. By linking ordering and delivery processes, real-time information about transports and delivery time windows, and the ability to provide inventory information in portals across company boundaries, they can help you to minimize the risks of the bullwhip effect.
IT-supported solutions for uniform reporting and forecasting are available and enable cross-company, collaborative monitoring of the situation.
Even in cases of extreme hardship, forecasts can ensure that companies are able to plan ahead, while critical situations remain manageable.
Is your company facing similar challenges? Do you want to establish a holistic collaboration in your network? We would be happy to advise you on the analysis of your individual requirements!
If you have any questions about this or other topics in the blog, please contact blog@leogistics.com.
Matthias Platzer
Senior Consultant SAP Logistics


