Without proper and purposeful reporting, companies spend money and resources wastefully. This is especially true in logistics, but more specifically in national/ international distribution centres, which serve as a connection link in your supply chain.
For example, even a slight drop in the departure latency of your trucks after loading has been finished may indicate structural difficulties. Was it perhaps due to stock accuracy, lack of replenishment for shelves or the picking performance of your packing machines? It definitely shows: regular reporting, logistical process analysis and early warning indicators were not carried out, installed or used insufficiently. Perhaps even existing numbers, key figures and their specific context were not adequately questioned, understood or checked.
Reporting with SAP EWM
Today more than ever, digital real-time information and its integration into your analytics need to be delivered properly for immediate analysis. User-friendly and professional data visualization are highly valuable in the logistics area as well. By “seeing”, trends and correlations are easily identified in reporting. For your logistics reporting, SAP EWM (Extended Warehouse Management) offers various reporting and analysis tools with different visualizations:
- Warehouse Cockpit@EWM: with direct data collection from the EWM system, preconfigured and formula-based key figures of tailored measurement services can be used for simple, graphical representation. The EasyGraphicFramework helps to create user-specific or cross-user cockpits.
- Warehouse Management Monitor@EWM: This monitor, as a list viewer and control instrument, is characterized by a large number of predefined reports. Personalization through your own layouts and reports supports your authorization concept and the segregation of duties in the warehouse; for example, between inbound and outbound shipping departments. Through a variety of interaction options and available methods, workflows can be controlled without opening the transaction for this.
- Reports@BW: SAP Business Warehouse (BW) integration is also supported by predefined extractors and content. After harmonizing and unification the data provided from EWM, BW infoproviders offer this information to the queries that process your key figures to be displayed.
- Performance Dashboard@BW: With this dashboard (extension add-on) installed on the BW system, delivery and inventory information can be viewed retrospectively for the past year or on a rolling 12-month basis. Predefined queries allow various indications such as inventory situation, storage costs or key figures for delivery positions in diagrams. The tabular detail view shows further information in the internet browser.
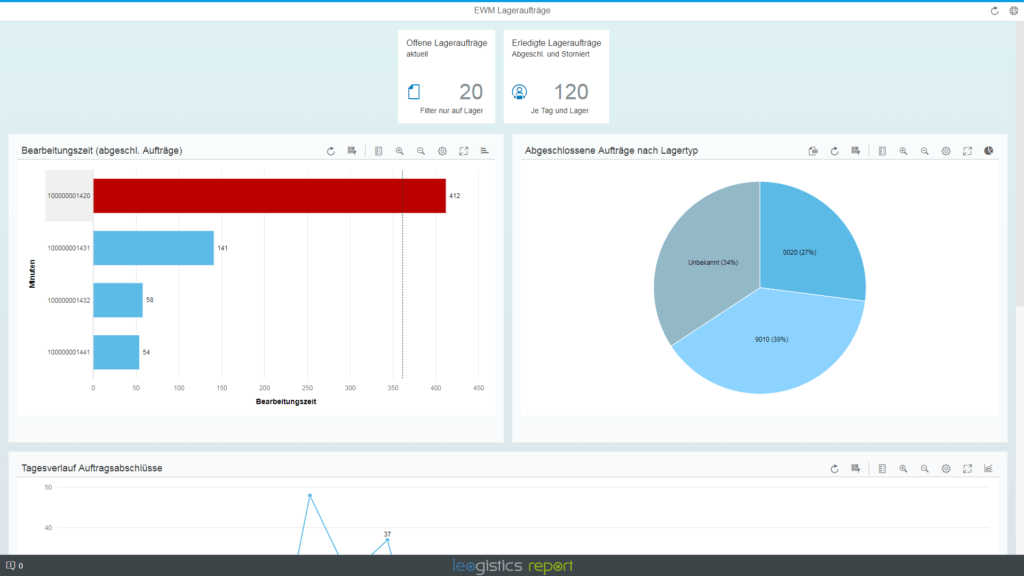
- leogistics reports@EWM: As an alternative to the reporting options mentioned above, leogistics offers a reporting tool directly linked to SAP EWM. A reporting in real time! The leogistics report SAP FIORI Dashboard can optionally be equipped with KPIs containing additional functions or charts. Configurable content, visualization and labels can create your custom-/user-driven dashboards you are using to control your processes, according to your authorization concept. For better integration into your supply chain, SAP TM (Transportation Management) yard and slot management solutions and other SAP modules can also be integrated: The Dashboard for your Supply Chain Execution Reporting.

Logistics excellence with leogistics
If you are lacking the right key performance indicators (KPIs) or relationships between the individual indicators, I can recommend the perspectives of the Balance Scorecard. The methodology helps to structure your strategic goals and all related indicators (input and output) to make dependencies visible. Imagine the potential of a dashboard for your production supply, if all relevant KPIs, including the planned arrival dates of your raw materials, the status of the goods receipt and the replenishment orders, current inventory situation, for example of the production supply area, production progress, outstanding production volumes, failure rates per assembly line, downtime rate and much more can be displayed. A dashboard for your SAP EWM processes and adjacent SAP modules.
We support to make the processes transparent together with appropriate reporting which is crucial to your success. Whether as operational reporting for the logistics team leader in the warehouse and as a dashboard in the warehouse manager’s office or as a strategic analysis function for your logistics planner, we offer you the right toolset that you can use beyond SAP EWM.
Make an appointment and let us talk about your individually customized demo.
For any further questions please contact blog@leogistics.com.
Henry Böhland und Paul Pohl
Consultants für SAP Logistics


